
quick hit infographics
To solve our affordable housing puzzle, we need to see all the pieces. Making housing data more accessible ensures we have the capacity for smart, data-driven decision-making. Because, let’s be real, who really has the time to read a *all* the research?! That’s why AHACO creates these issue-area infographics, blending together scientifically sound research with instant local surveys to show how housing affects our people and our lives. If you’ve got a suggestion for our next topic, send it our way!
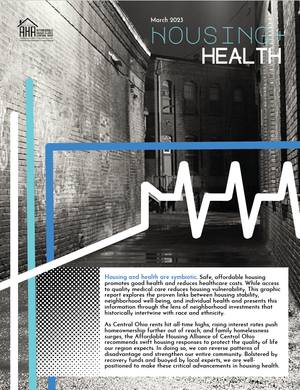
Health+Housing, 2022
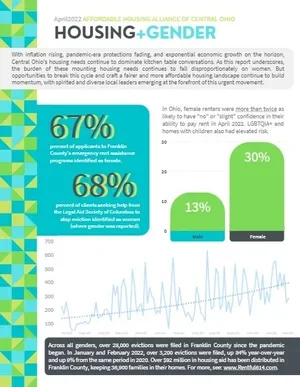
Gender+Housing, 2022
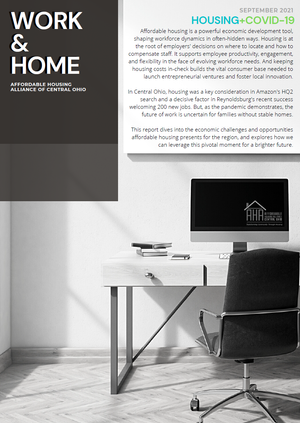
Work+Housing, 2021
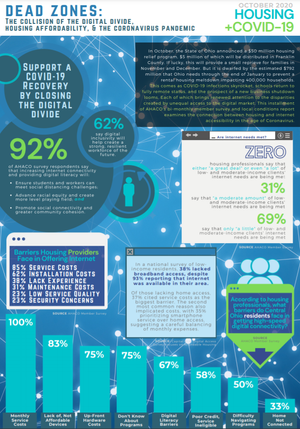
Connectivity+Housing, 2020
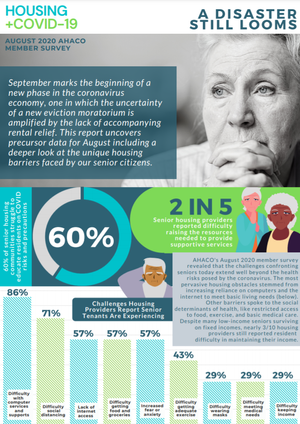
Aging+Housing, 2020
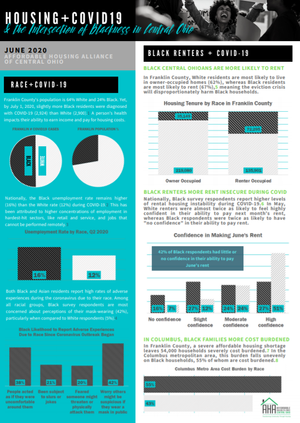
Race+Housing, 2020